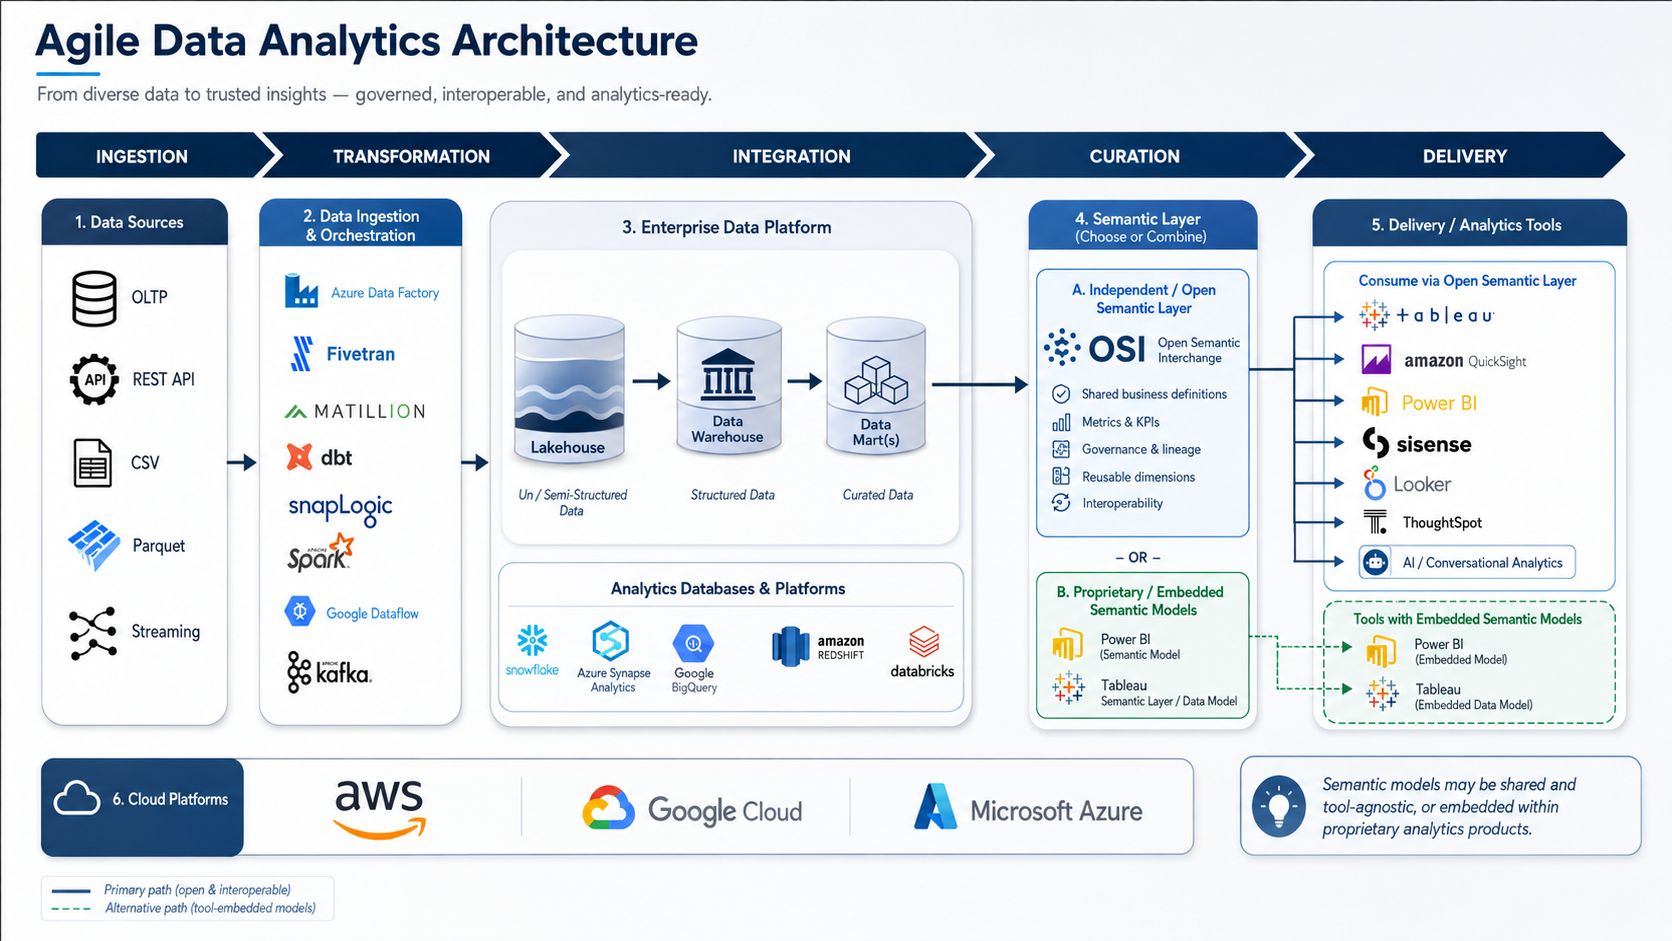
Architecting for Agility
Modern cloud platforms, analytics databases, data ingestion and process orchestration tools, and data analysis and visualization products provide powerful data integration and curation capabilities. These provide organizations the ability to deliver analytics which support routine operations, emerging challenges, experimental projects, and strategic planning. The diagram below illustrates the architecture framework I apply, implemented at organizations ranging from a national QSR chain to mortgage servicing operations.
Operational Performance Recap
The Operational Performance Recap shows a mobile-friendly view of Key Performance Indicators. The timeframe being viewed is selectable, high-level metrics and trends are presented, and all have drill-down pages which show more detail.
Underlying this dashboard is a sophisticated data architecture and a metrics layer supporting an integrated set of Tableau-based dashboards.
The Semantic Layer: Where Metrics Live Once
The most durable investment in an analytics architecture is a properly designed semantic layer: the place where business metric definitions live once and propagate to every consumer. This is the difference between a BI environment where the same KPI shows up three different ways depending on which dashboard you open, and one where a leadership team can trust any number on any screen.
At Raising Cane's, I built the Operations Recap Data Mart, a multi-grain operational fact table paired with a published Tableau Data Source that served as the semantic layer for 800+ restaurants. One schema, one set of metric definitions, four distinct audiences. Same-restaurant-sales comparability, restaurant lifecycle status, and ratio-of-sums KPIs were defined in the Data Source and inherited automatically by every workbook. When a definition changed, it propagated everywhere.
The same discipline applies in modern warehouse-side implementations: Snowflake Semantic Views, Databricks Metric Views, dbt MetricFlow, where the metric definitions move into the data layer so AI agents, embedded analytics, and multiple BI tools all consume the same governed definitions.
- A well-curated enterprise data warehouse holding atomic facts and conformed dimensions
- A semantic layer that defines business meaning once, above the warehouse, below the BI tool
- Deliberately variable grain: detail where decisions depend on it, rollup where they don't
- Self-service zones where analysts augment centralized data without compromising core definitions
- Automated pipelines with quality checks and lineage tracking at every stage